Routing System.Diagnostics.Trace and System.Diagnostics.TraceSource logs through NLog
02 Sep 2010I have recently added a trace listener class for NLog, which enables routing of System.Diagnostics.Trace and System.Diagnostics.TraceSource logs through your favorite log routing engine. This can be very useful for integrating components that don’t necessarily support logging through NLog as well as analyzing traces produced .NET Framework itself.
By using NLog trace listener you can send those logs via email, save them to a database, file or to any other supported log targets.
Let’s create a simple example – application that makes network call. We will then enable network call tracing without touching a single line of code.
namespace TraceDemo
{
  using System.Net;

  class Program
  {
    static void Main(string[] args)
    {
      var webClient = new WebClient();
      webClient.DownloadString("http://somehost/nosuchfile.txt");
    }
  }
}
As you can see the example is just using WebClient from System.Net namespace, and has no tracing-specific code. Internally WebClient is capable of outputting traces through System.Net trace source. To route those traces through NLog you need to assign a listener to each source in the application configuration file. It is convenient to define NLogTraceListener as a shared listener and reference by name in all sources that you need as in the following example:
<?xml version="1.0" encoding="utf-8" ?>
<configuration>
  <system.diagnostics>
    <sources>
      <source name="System.Net" switchValue="All">
        <listeners>
          <add name="nlog" />
        </listeners>
      </source>
      <source name="System.Net.Sockets" switchValue="All">
        <listeners>
          <add name="nlog" />
        </listeners>
      </source>
    </sources>
    <sharedListeners>
      <add name="nlog" type="NLog.NLogTraceListener, NLog" />
    </sharedListeners>
  </system.diagnostics>
</configuration>
Alternative one can register NLogTraceListener from code:
System.Diagnostics.Trace.Listeners.Clear();
System.Diagnostics.Trace.Listeners.Add(new NLog.NLogTraceListener { Name = "NLog" });
System.Diagnostics.Trace.WriteLine("Hello World");
To redirect output to NLog target, then obviously you also need NLog.dll and NLog.config to be located in the application directory. For our purposes we’ll use simple configuration with single target:
<nlog>
<targets>
<target name="console" type="ColoredConsole" layout="${longdate} ${level} ${message}" />
</targets>
<rules>
<logger name="*" minlevel="Trace" writeTo="console" />
</rules>
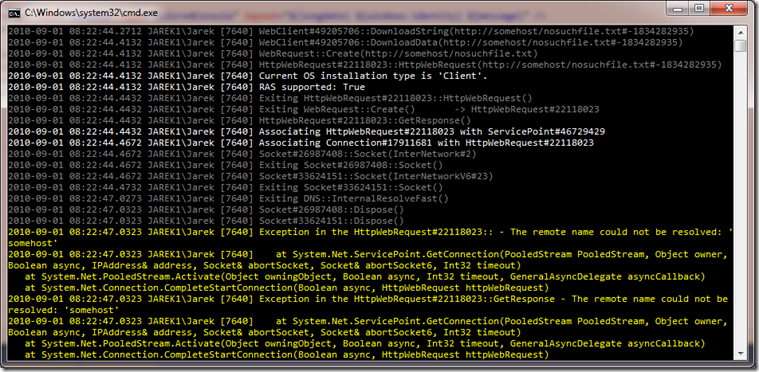
</nlog>When you run this application, you will get nice color-coded trace that includes lots of diagnostics information straight from the guts of .NET Framework. Having access to detailed trace like this can be very helpful in diagnosing hard-to-reproduce problems that are often impossible to figure out with a debugger.